Map Loading... πŸ—ΊοΈπŸ“πŸŽ¨

Experimenting with different vector map style loading times using maplibre-gl.

When using a map on a digital device, it is important that it is fast to load and the map interactions are seamlessly smooth. A fast loading map will go by unnoticed as “everything works” leading to a natural feeling experience. A slow loading map will get in the way of a good user experience, leading to frustration, grief and a bad taste in the mouth.

GIF of a slow loading map
A slow loading map

Vector maps are being used more and more on the web. They offer a faster and more interactive experience and more ways of being styled.

What is a vector map?

Vector maps use vector data, made up of points, lines and polygons with accompanying meta-data. This is downloaded to the device and the map you end up seeing on the screen, is as a result of rendering on the client side and certain styling instructions.

Vector maps are the opposite of raster maps, which are made up of pixel data pre-rendered on a server. Raster maps are harder to manipulate and style.

The best resource out there to to have a refresh on web maps is mapschool.io. It explains the difference between raster and vector maps and much more.

I am using maplibre-gl, which is a vector map library in a hobby project and interested in finding out which map style is the fastest to load.

A vector map library needs a recipe to draw a map on the screen. The recipe will have instructions telling the mapping library where to request the vector data from and how to render that data to the screen. Rendering instructions include what parts of the data to draw, what colors to use and what order to draw the layers of data in.

When you pan and zoom to a specific part of a vector map, the library will know based on this recipe, where to request the body of data that should fill up the screen and how to style it.

What else is it called?
This recipe is often called a style document, which is usually a json file conforming to a specification (in my case the Maplibre style spec).

A good designer aka a cartograpaher, will design a style in a way that it shows off the best parts of the data with certain balance of space and color, producing something that looks appealing and allows easy reading of the data.

A artist painting a map

The time taken to display a map on the screen will depend on where the data comes from and how complex the rendering instructions are.

It makes sense that a style that is simple and requests a little data from somewhere close to the user will load faster than a style that is complex and requests a lot of data from somewhere far away from the user.

Here is a taste of a style Γ  la MapTiler Basic Light**

(note: I have omitted most parts to simplify the example)

 1
 2
 3
 4
 5
 6
 7
 8
 9
10
11
12
13
14
15
16
17
18
19
20
21
22
23
24
25
26
27
28
29
30
31
32
33
34
35
36
37
38
39
40
41
42
43
44
45
46
47
48
49
50
51
52
53
54
55
56
57
58
59
60
61
62
63
{
  "version": 8,
  "id": "basic",
  "name": "Basic Light**",
  "sources": {
    "openmaptiles": {
      "url": "https://api.maptiler.com/tiles/v3/tiles.json?key={YOUR_API_KEY}",
      "type": "vector"
    },
    "maptiler_attribution": {
      "attribution": "<a href=\"https://www.maptiler.com/copyright/\" target=\"_blank\">&copy; MapTiler</a> <a href=\"https://www.openstreetmap.org/copyright\" target=\"_blank\">&copy; OpenStreetMap contributors</a>",
      "type": "vector"
    }
  },
  "layers": [
    {
      "id": "background",
      "type": "background",
      "paint": { "background-color": "rgba(224, 224, 208, 1)" }
    },
    {
      "id": "landcover_grass",
      "type": "fill",
      "source": "openmaptiles",
      "source-layer": "landcover",
      "paint": { "fill-color": "rgba(192, 213, 169, 1)", "fill-opacity": 0.4 },
      "filter": ["==", "class", "grass"]
    },
    {
      "id": "landcover_wood",
      "type": "fill",
      "source": "openmaptiles",
      "source-layer": "landcover",
      "paint": { "fill-color": "hsl(82, 46%, 72%)", "fill-opacity": 0.8 },
      "filter": ["==", "class", "wood"]
    },
    {
      "id": "water",
      "type": "fill",
      "source": "openmaptiles",
      "source-layer": "water",
      "layout": { "visibility": "visible" },
      "paint": { "fill-color": "hsl(205, 56%, 73%)" },
      "filter": ["all", ["!=", "intermittent", 1], ["!=", "brunnel", "tunnel"]]
    },
    {
      "id": "building",
      "type": "fill",
      "source": "openmaptiles",
      "source-layer": "building",
      "paint": {
        "fill-color": "rgba(212, 204, 176, 1)",
        "fill-opacity": 0.6,
        "fill-antialias": true
      }
    },
  ],
  "glyphs": "https://api.maptiler.com/fonts/{fontstack}/{range}.pbf?key={YOUR_API_KEY}",
  "bearing": 0,
  "pitch": 0,
  "center": [0, 0],
  "zoom": 1
}

It a very simple style that only shows a few of the features you would expect of a map. It has a background color, grass and wood areas, water, buildings and some text.

There are two sources of data, one for the map data and one for the attribution. This informs the library where to request data from the tile server with address https://api.maptiler.com/tiles/v3/tiles.json?key={YOUR_API_KEY}.

The layers key is where the rendering instructions are. Each layer has an id, a type, a source (in our case it is always the single openmaptiles source) and some paint instructions.

The background gets loaded, polygons of grass gets drawn with a opaque green, water gets drawn in blue, but not when it goes through a tunnel, building footprints rise up.

Paint instructions can get quite complex, and contain many conditional rules and transformations. Things that can be controlled are the size lines, opacity of fills and the font of the text.

The combination of vector and raster
Vector maps can also contain raster data layers. The raster data is delivered pre-rendered and is ready to be drawn on the screen. This is useful for things like satellite imagery, where the data is too complex to be drawn on the fly.

See the sources key in the above style document. This is where the vector data is served from. The data is served in a format called vector tiles. These are small chunks of data that are ready to be drawn on the screen. The data is normally served in a format that is easy to draw and easy to style.

What format is the data in?

Mapbox created the Mapbox Vector Tile Specification.

The data is encoded in a format called Protocol Buffers. This is a fast to parse and is easy to compress binary format. This is why it is used for vector tiles.

There are many tools out there to generate and serve vector tiles. The Awesome vector tiles

The ideal place to get the data is the clients device storage. This is fast as the data is ready to be used straight away without requesting and downloading it over a internet connection. But this is not practical for most use cases.

The next best thing is a server vector tile server. This server can be hosted by a tile service provider, or it can be hosted by yourself. There are lots of tools out there to roll your own solution. The Awesome vector tiles repo on github is a good place to start.

Most people will use a third party provider for ease and other reasons instead of DIYing. These providers will have servers all over the world that will serve the data to the user close to where they are.

There are many different places to get vector map styles. Providers offer them. Some of them are free, some of them are paid. Some of them are open source, some of them are closed source. Some of them result in a fast loading experience, some do not.

Different providers offer different styles and it is not always clear which one is the fastest, the Usain Bolt of map styles.

It is also possible to write a custom style, and there are many tools out there that can help you. Maplibre-gl has a style spec that you can use to write your own style. MapTiler has a online style editor that you can use to create your own style.

I used playwright, a browser automation library to launch a chromium browser, initialize a map with a style and time how long it took for the relevant loaded event to fire. This was done for a number of different styles.

The experiment was run on my local machine (A 10 year old HP Pavilion) with a 50mbps internet connection somewhere in Germany.

All the code is available in this repo if you want to replicate the experiment.

Note: Your mileage may vary depending on your hardware and internet connection.

The Open Street Map Wiki lists different vector tile providers. I tested the following:

The styles tested
ProviderStyleURL
MapTilerBackdrophttps://api.maptiler.com/maps/backdrop/style.json?key={API_KEY}
MapTilerBasichttps://api.maptiler.com/maps/basic/style.json?key={API_KEY}
MapTilerBrighthttps://api.maptiler.com/maps/bright/style.json?key={API_KEY}
MapTilerDatavizhttps://api.maptiler.com/maps/dataviz/style.json?key={API_KEY}
MapTilerLandscapehttps://api.maptiler.com/maps/landscape/style.json?key={API_KEY}
MapTilerOceanhttps://api.maptiler.com/maps/ocean/style.json?key={API_KEY}
MapTilerOpenStreetMaphttps://api.maptiler.com/maps/openstreetmap/style.json?key={API_KEY}
MapTilerOutdoorhttps://api.maptiler.com/maps/outdoor/style.json?key={API_KEY}
MapTilerSatellitehttps://api.maptiler.com/maps/satellite/style.json?key={API_KEY}
MapTilerStreetshttps://api.maptiler.com/maps/streets/style.json?key={API_KEY}
MapTilerTonerhttps://api.maptiler.com/maps/toner/style.json?key={API_KEY}
MapTilerTopohttps://api.maptiler.com/maps/topo/style.json?key={API_KEY}
MapTilerWinterhttps://api.maptiler.com/maps/winter/style.json?key={API_KEY}
StadiaMapsAlidade Smoothhttps://tiles.stadiamaps.com/styles/alidade_smooth.json?api_key={API_KEY}
StadiaMapsAlidade Smooth Darkhttps://tiles.stadiamaps.com/styles/alidade_smooth_dark.json?api_key={API_KEY}
StadiaMapsAlidade Satellitehttps://tiles.stadiamaps.com/styles/alidade_satellite.json?api_key={API_KEY}
StadiaMapsStadia Outdoorshttps://tiles.stadiamaps.com/styles/stadia_outdoors.json?api_key={API_KEY}
StadiaMapsStamen Tonerhttps://tiles.stadiamaps.com/styles/stamen_toner.json?api_key={API_KEY}
StadiaMapsStamen Terrainhttps://tiles.stadiamaps.com/styles/stamen_terrain.json?api_key={API_KEY}
StadiaMapsStamen Watercolorhttps://tiles.stadiamaps.com/styles/stamen_watercolor.json?api_key={API_KEY}
StadiaMapsOSM Brighthttps://tiles.stadiamaps.com/styles/osm_bright.json?api_key={API_KEY}
  1
  2
  3
  4
  5
  6
  7
  8
  9
 10
 11
 12
 13
 14
 15
 16
 17
 18
 19
 20
 21
 22
 23
 24
 25
 26
 27
 28
 29
 30
 31
 32
 33
 34
 35
 36
 37
 38
 39
 40
 41
 42
 43
 44
 45
 46
 47
 48
 49
 50
 51
 52
 53
 54
 55
 56
 57
 58
 59
 60
 61
 62
 63
 64
 65
 66
 67
 68
 69
 70
 71
 72
 73
 74
 75
 76
 77
 78
 79
 80
 81
 82
 83
 84
 85
 86
 87
 88
 89
 90
 91
 92
 93
 94
 95
 96
 97
 98
 99
100
101
102
103
104
105
106
107
108
109
110
111
112
113
import asyncio
import os
from playwright.async_api import async_playwright

MAPTILER_API_KEY = os.environ.get("MAPTILER_API_KEY")
STADIA_API_KEY = os.environ.get("STADIA_API_KEY")

if MAPTILER_API_KEY is None or STADIA_API_KEY is None:
    raise ValueError(
        "MAPTILER_API_KEY and STADIA_API_KEY environment variables must be set"
    )

STYLES = {
    "MapTiler - Backdrop": f"https://api.maptiler.com/maps/backdrop/style.json?key={MAPTILER_API_KEY}",
    "MapTiler - Basic": f"https://api.maptiler.com/maps/basic/style.json?key={MAPTILER_API_KEY}",
    "Maptiler - Bright": f"https://api.maptiler.com/maps/bright/style.json?key={MAPTILER_API_KEY}",
    "Maptiler - Dataviz": f"https://api.maptiler.com/maps/dataviz/style.json?key={MAPTILER_API_KEY}",
    "Maptiler - Landscape": f"https://api.maptiler.com/maps/landscape/style.json?key={MAPTILER_API_KEY}",
    "Maptiler - Ocean": f"https://api.maptiler.com/maps/ocean/style.json?key={MAPTILER_API_KEY}",
    "Maptiler - OpenStreetMap": f"https://api.maptiler.com/maps/openstreetmap/style.json?key={MAPTILER_API_KEY}",
    "Maptiler - Outdoor": f"https://api.maptiler.com/maps/outdoor/style.json?key={MAPTILER_API_KEY}",
    "Maptiler - Satellite": f"https://api.maptiler.com/maps/satellite/style.json?key={MAPTILER_API_KEY}",
    "Maptiler - Streets": f"https://api.maptiler.com/maps/streets/style.json?key={MAPTILER_API_KEY}",
    "Maptiler - Toner": f"https://api.maptiler.com/maps/toner/style.json?key={MAPTILER_API_KEY}",
    "Maptiler - Topo": f"https://api.maptiler.com/maps/topo/style.json?key={MAPTILER_API_KEY}",
    "Maptiler - Winter": f"https://api.maptiler.com/maps/winter/style.json?key={MAPTILER_API_KEY}",
    "StadiaMaps - Alidade Smooth": f"https://tiles.stadiamaps.com/styles/alidade_smooth.json?api_key={STADIA_API_KEY}",
    "StadiaMaps - Alidade Smooth Dark": f"https://tiles.stadiamaps.com/styles/alidade_smooth_dark.json?api_key={STADIA_API_KEY}",
    "StadiaMaps - Alidade Satellite": f"https://tiles.stadiamaps.com/styles/alidade_satellite.json?api_key={STADIA_API_KEY}",
    "StadiaMaps - Stadia Outdoors": f"https://tiles.stadiamaps.com/styles/outdoors.json?api_key={STADIA_API_KEY}",
    "StadiaMaps - Stamen Toner": f"https://tiles.stadiamaps.com/styles/stamen_toner.json?api_key={STADIA_API_KEY}",
    "StadiaMaps - Stamen Terrain": f"https://tiles.stadiamaps.com/styles/stamen_terrain.json?api_key={STADIA_API_KEY}",
    "StadiaMaps - Stamen Watercolor": f"https://tiles.stadiamaps.com/styles/stamen_watercolor.json?api_key={STADIA_API_KEY}",
    "StadiaMaps - OSM Bright": f"https://tiles.stadiamaps.com/styles/osm_bright.json?api_key={STADIA_API_KEY}",
}

async def time_style(style_name, style_url):
    html_content = f"""
    <!DOCTYPE html>
    <html>
    <head>
        <title>Vector Map Style Profiler</title>
        <script src="https://unpkg.com/maplibre-gl@3.6.2/dist/maplibre-gl.js"></script>
        <link href="https://unpkg.com/maplibre-gl@3.6.2/dist/maplibre-gl.css" rel="stylesheet">
    </head>

    <style>
        html {{
            height: 100%;
        }}

        body {{
            height: 100%;
            align-items: stretch;
            margin: 0;
            padding: 0;
        }}

        #map {{
            flex-grow: 1;
            min-height: 100%;
            max-height: 100%;
        }}
    </style>

    <body>
        <div id="map" style="width: 100%; height: 100%;"></div>
        <script>
            const startTime = performance.now();
            const map = new maplibregl.Map({{
                container: "map",
                style: "{style_url}",
                center: [0, 51.4769], // Greenwich meridian
                zoom: 10,
                maxZoom: 18,
                minZoom: 5,
            }});

            map.on('load', (e) => {{
                const endLoadTime = performance.now();
                loadTime = endLoadTime - startTime;
                window.loadTime = loadTime;
            }});

        </script>
    </body>

    </html>
    """

    async with async_playwright() as p:
        browser_type = p.chromium
        browser = await browser_type.launch()
        page = await browser.new_page()

        try:
            await page.set_content(html_content)
            await page.wait_for_function("window.loadTime", timeout=30000)
            load_time = await page.evaluate("() => { return window.loadTime; }")
            print(f"{style_name}: {load_time}")

        except asyncio.TimeoutError:
            print(f"Timeout occurred for {style_name}")

        except Exception as e:
            print(f"An error occurred for {style_name}: {str(e)}")

        finally:
            await browser.close()


for k, v in STYLES.items():
    asyncio.run(time_style(k, v))

All code is available in the mapStyleProfile github repository.

The Results Table
Provider - StyleTime to load (ms)
StadiaMaps - Stamen Watercolor709
Maptiler - Dataviz1702
Maptiler - Toner2156
StadiaMaps - Alidade Smooth2181
MapTiler - Basic2324
Maptiler - Satellite2368
StadiaMaps - Stamen Toner2573
MapTiler - Backdrop2692
Maptiler - Streets2694
StadiaMaps - OSM Bright2848
Maptiler - OpenStreetMap2954
StadiaMaps - Stadia Outdoors2990
Maptiler - Bright3005
StadiaMaps - Alidade Smooth Dark3169
Maptiler - Ocean3679
Maptiler - Outdoor4030
Maptiler - Landscape4513
Maptiler - Topo4629
StadiaMaps - Stamen Terrain5670
Maptiler - Winter5827

Now there are some numbers to quantify the different map styles speed.

Remember speed isn’t everything, and a good map experience is a combination of many things. A fast loading map is just one part of the puzzle, along with space and color, compromises may have to be made to get the best overall experience.

I made a online tool that lets you paste a style url into it and it will time how long it takes to load the map.

Screenshot of the online tool

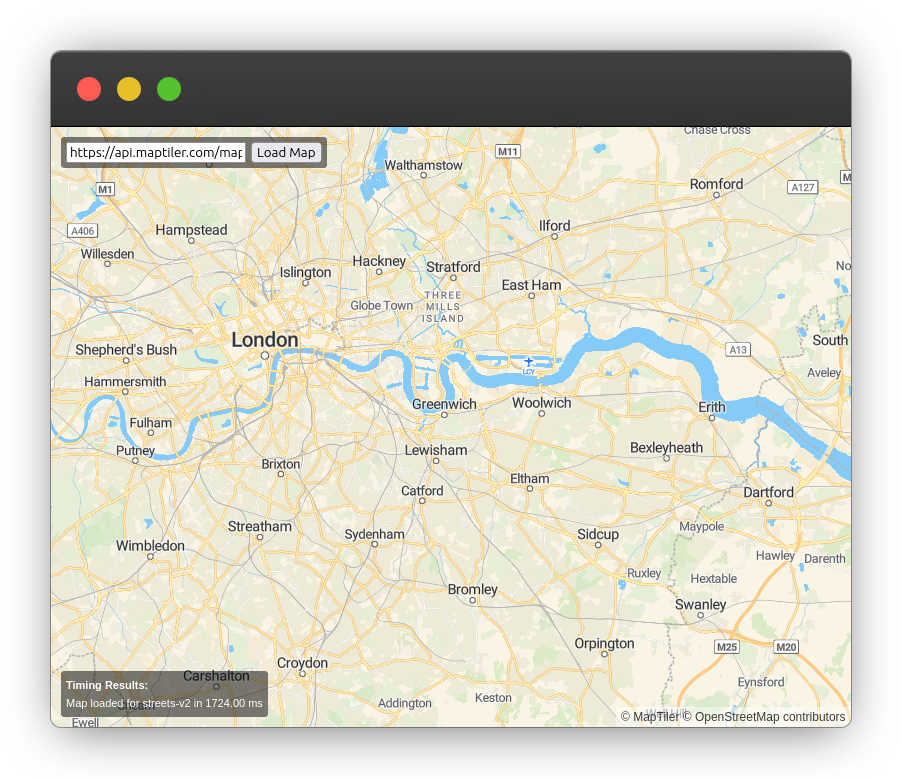
All source code is available in the same github repository.

This was a simple experiment to get some numbers on the different map styles, only looking at two providers.

There are a few things that could be done to improve the experiment:

  • Add more styles from different providers to get a better idea of the landscape.
  • Profile the different parts of the map loading process to break down ingload time
  • Add more “real world” interactions to the experiment and see how the styles perform under different conditions.
  • Set up a github action to run the experiment on pull requests and provided a central place to see the results.